Generating the SuperScreen logo
The SuperScreen logo is a superconducting “S” screening a uniform applied magnetic field. This notebook generates the logo as follows:
Define a
matplotlibTextPathobject and use it to extract polygon vertices that draw an “S”.Create a
superscreen.Deviceto represent the superconducting “S”.Solve for the response of the “S” to an applied magnetic field.
Visualize the resulting screening currents and fields.
[1]:
# Automatically install superscreen from GitHub only if running in Google Colab
if "google.colab" in str(get_ipython()):
    %pip install --quiet git+https://github.com/loganbvh/superscreen.git
[2]:
%config InlineBackend.figure_formats = {"retina", "png"}
%matplotlib inline

import os

os.environ["OPENBLAS_NUM_THREADS"] = "1"

import numpy as np
from matplotlib.textpath import TextPath
from matplotlib.font_manager import FontProperties

import superscreen as sc

SAVE = True
[3]:
sc.version_table()
[3]:
| Software | Version |
|---|---|
| SuperScreen | 0.10.6 |
| Numpy | 1.26.4 |
| Numba | 0.59.0 |
| SciPy | 1.12.0 |
| matplotlib | 3.8.3 |
| IPython | 8.18.1 |
| Python | 3.9.18 (main, Feb 1 2024, 17:16:01) [GCC 9.4.0] |
| OS | posix [linux] |
| Number of CPUs | Physical: 1, Logical: 2 |
| BLAS Info | Generic |
| Sun Mar 10 18:31:10 2024 UTC | |
Define the TextPath:
[4]:
fontprops = FontProperties(weight="bold", family="sans-serif")
path = TextPath((0, 0), "S", size=10, prop=fontprops)
Sample each of the TextPath’s Bezier curves to get polygon vertices:
[5]:
t = np.linspace(0, 1, 11)
segments = [bezier(t) for bezier, _ in path.iter_bezier()]
points = np.concatenate(segments)
Center the resulting points and remove duplicates:
[6]:
points -= points.mean(axis=0)
_, ix = np.unique(points, axis=0, return_index=True)
points = points[np.sort(ix)]
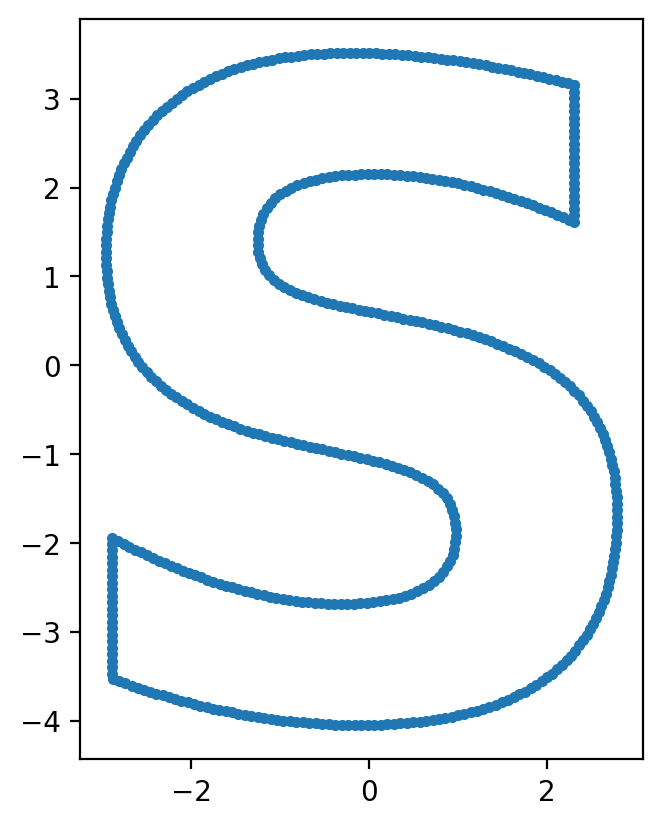
Create and plot a superscreen.Polygon representing the “S”:
[7]:
S = sc.Polygon(points=points).resample(501)
ax = S.plot(marker=".")
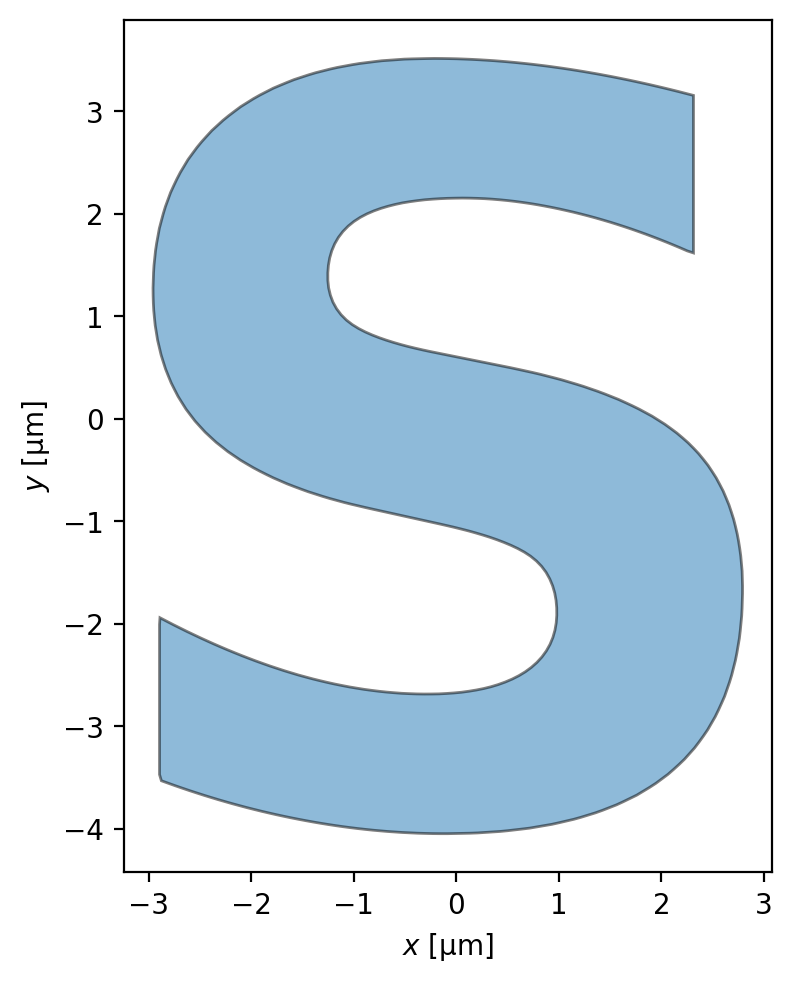
Create a Device containing the Polygon:
[8]:
layers = [sc.Layer("base", Lambda=1, z0=0)]
S.layer = "base"
S.name = "S"
device = sc.Device("S", layers=layers, films=[S])
[9]:
fig, ax = device.draw()
[10]:
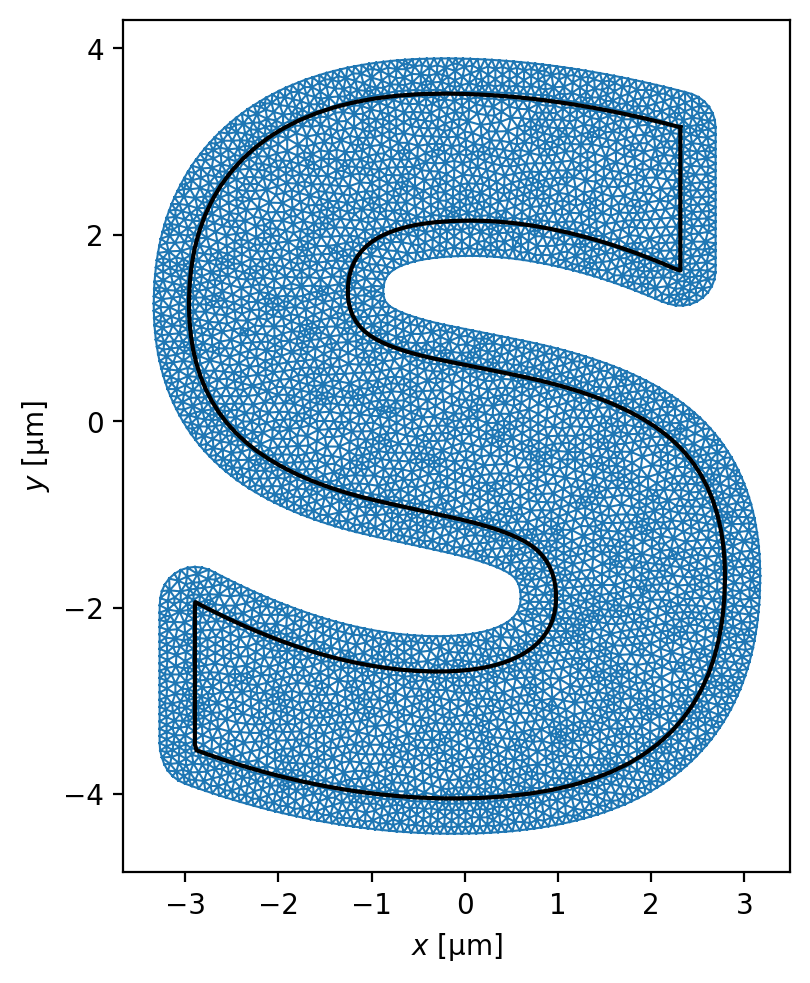
device.make_mesh(max_edge_length=0.15, smooth=100)
[11]:
fig, ax = device.plot_mesh(show_sites=False)
_ = device.plot_polygons(ax=ax, color="k")
Solve for the Device’s response to a constant applied field:
[12]:
solutions = sc.solve(
    device=device,
    applied_field=sc.sources.ConstantField(1),
    field_units="mT",
    current_units="uA",
)
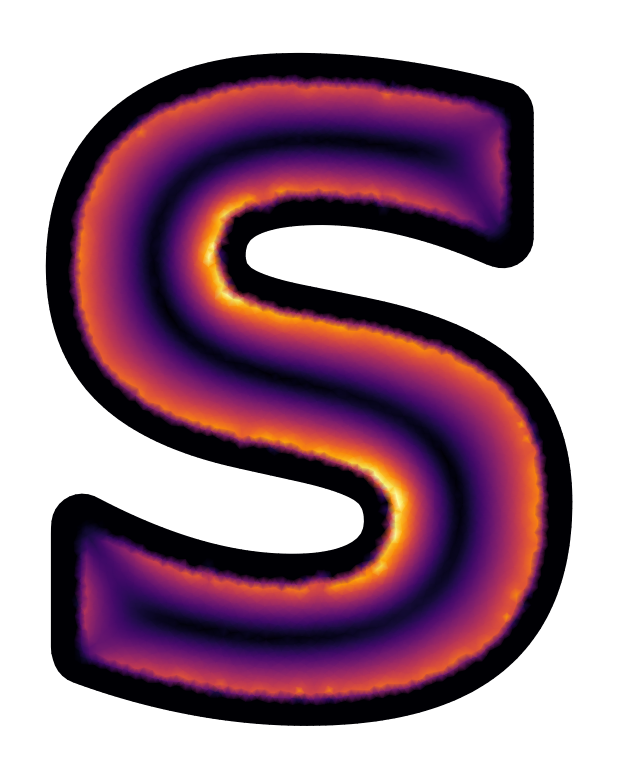
Plot and save the results:
[13]:
fig_formats = ["png"]
[14]:
fig, axes = solutions[-1].plot_currents(
    vmin=0,
    vmax=750,
    streamplot=False,
    colorbar=False,
    shading="gouraud",
)

for a in axes:
    a.axis("off")
    a.set_title("")

if SAVE:
    fig.set_facecolor("none")
    for fmt in fig_formats:
        fig.savefig(f"../images/logo_currents.{fmt}", dpi=600, bbox_inches="tight")
[15]:
fig, axes = solutions[-1].plot_currents(
    streamplot=False,
    vmin=0,
    vmax=750,
    shading="gouraud",
    colorbar=False,
)

for a in axes:
    a.axis("off")
    a.set_title("")
    a.set_xlim(-25, 25)
    a.set_ylim(-5.1, 5.1)

if SAVE:
    fig.set_facecolor("none")
    for fmt in fig_formats:
        fig.savefig(
            f"../images/logo_currents_small.{fmt}", dpi=600, bbox_inches="tight"
        )

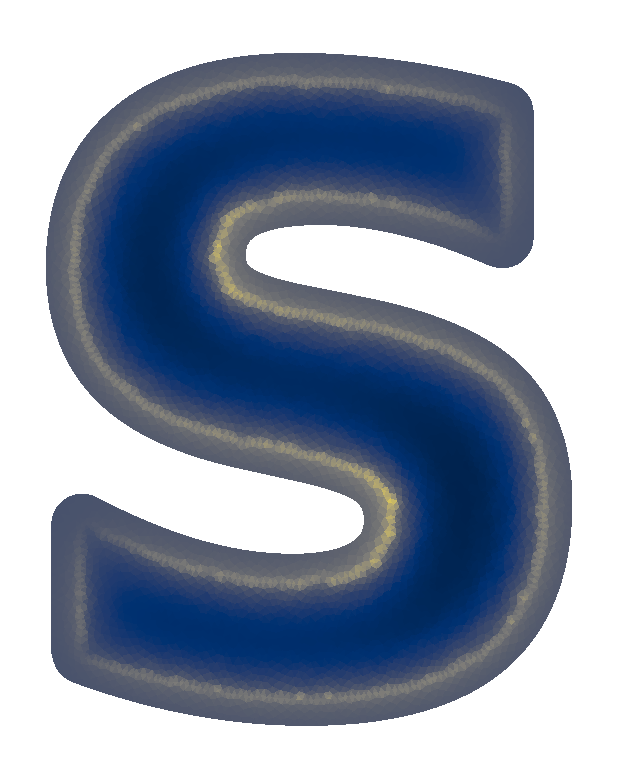
[16]:
fig, axes = solutions[-1].plot_fields(colorbar=False)

for a in axes:
    a.axis("off")
    a.set_title("")

if SAVE:
    fig.set_facecolor("none")
    for fmt in fig_formats:
        fig.savefig(f"../images/logo_fields.{fmt}", dpi=600, bbox_inches="tight")
[17]:
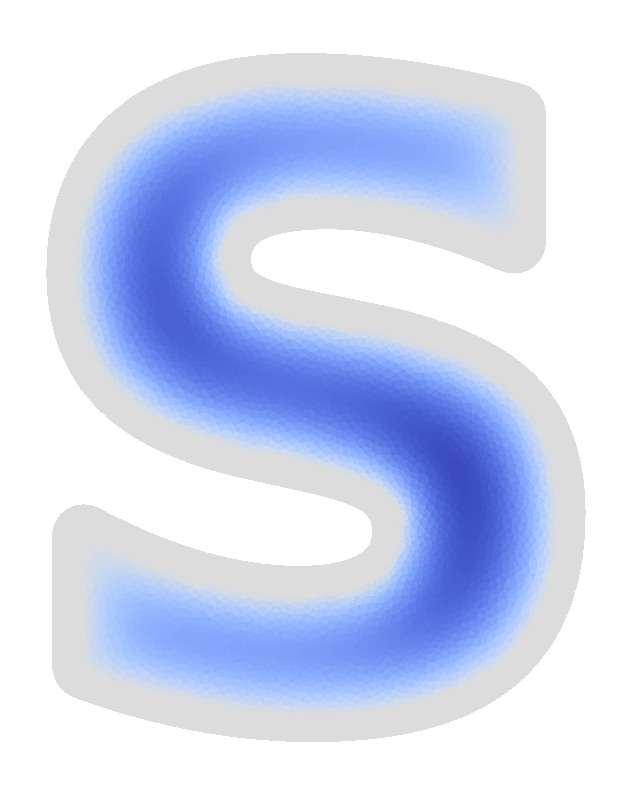
fig, axes = solutions[-1].plot_streams(colorbar=False)

for a in axes:
    a.axis("off")
    a.set_title("")

if SAVE:
    fig.set_facecolor("none")
    for fmt in fig_formats:
        fig.savefig(f"../images/logo_streams.{fmt}", dpi=600, bbox_inches="tight")
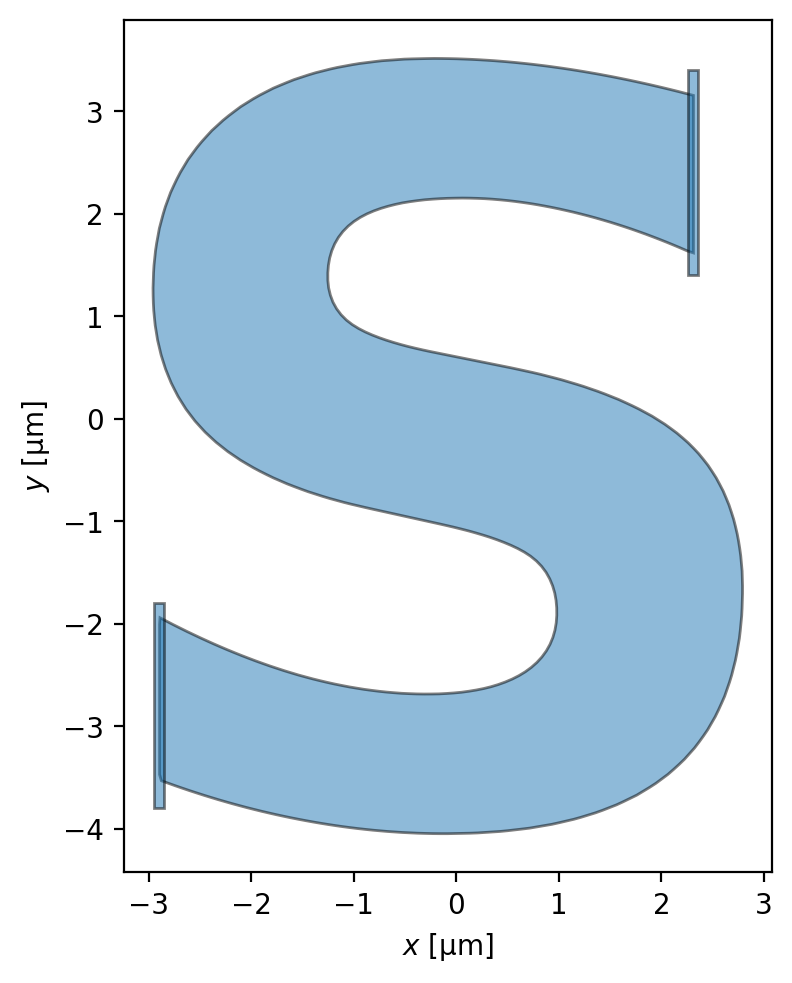
[18]:
device = sc.Device(
    "S",
    layers=layers,
    films=[S],
    terminals={
        "S": [
            sc.Polygon("source", points=sc.geometry.box(0.1, 2, center=(2.31, 2.4))),
            sc.Polygon("drain", points=sc.geometry.box(0.1, 2, center=(-2.9, -2.8))),
        ],
    },
)
[19]:
_ = device.draw()
[20]:
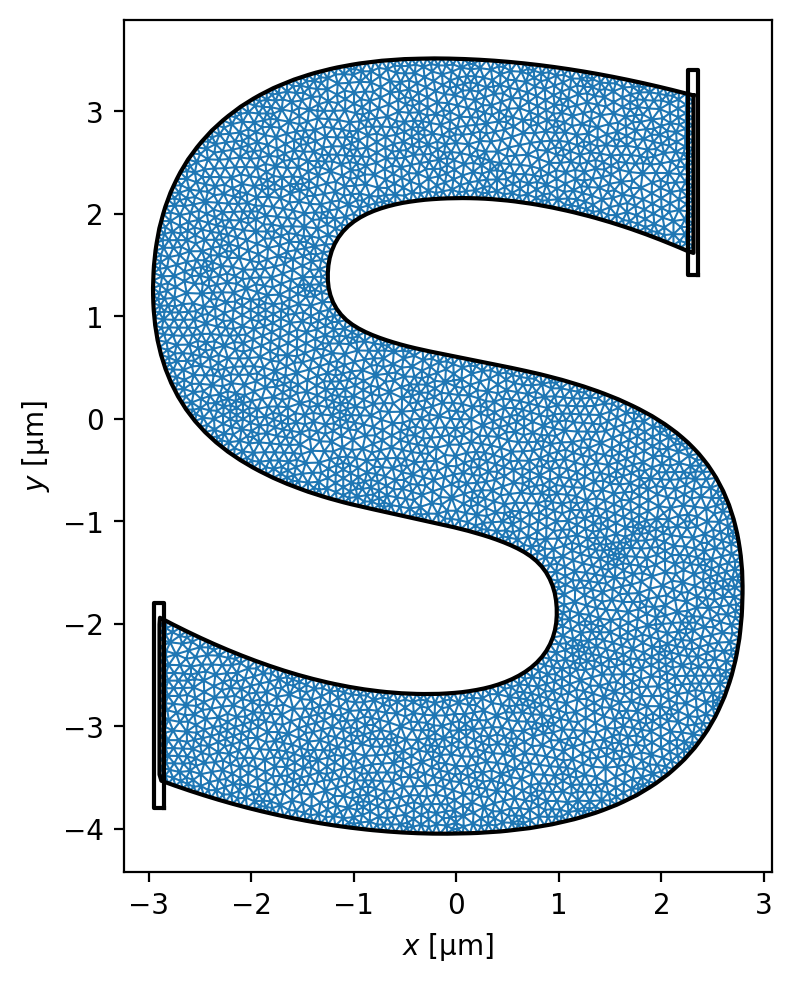
device.make_mesh(max_edge_length=0.15, smooth=100)
[21]:
fig, ax = device.plot_mesh(show_sites=False)
_ = device.plot_polygons(ax=ax, color="k")
[22]:
solutions = sc.solve(device, terminal_currents={"S": {"source": "10 uA", "drain": "-10 uA"}})
[23]:
fig, axes = solutions[-1].plot_currents(
    grid_shape=500,
    streamplot=True,
    colorbar=False,
    vmin=0,
    vmax=15,
)
fig.set_facecolor("k")

for a in axes:
    a.axis("off")
    a.set_title("")

if SAVE:
    for fmt in fig_formats:
        fig.savefig(
            f"../images/logo_terminal_currents.{fmt}", dpi=600, bbox_inches="tight"
        )

[24]:
fig, axes = solutions[-1].plot_streams(colorbar=False)

for a in axes:
    a.axis("off")
    a.set_title("")

if SAVE:
    fig.set_facecolor("none")
    for fmt in fig_formats:
        fig.savefig(
            f"../images/logo_terminal_streams.{fmt}", dpi=600, bbox_inches="tight"
        )

[ ]: